安装matplotlib
win+r输入cmd打开命令行输入
pip install matplotlibmatplotlib绘制折线统计图
pyplot模块
绘制线条|plot方法
pyplot.ploy(x,y,color=颜色,linestyle=线条风格,linewidth=线条粗细,alpha=线条透明度)pyplot模块中有一个plot方法传入2个参数,第一个参数(可迭代对象)作为数据的x轴坐标,第二个参数(可迭代对象)作为数据的y轴坐标。
color参数
*来自官方源码注释
        **Colors**

        The supported color abbreviations are the single letter codes

        =============    ===============================
        character        color
        =============    ===============================
        ``'b'``          blue
        ``'g'``          green
        ``'r'``          red
        ``'c'``          cyan
        ``'m'``          magenta
        ``'y'``          yellow
        ``'k'``          black
        ``'w'``          white
        =============    ===============================

        and the ``'CN'`` colors that index into the default property cycle.

        If the color is the only part of the format string, you can
        additionally use any  `matplotlib.colors` spec, e.g. full names
        (``'green'``) or hex strings (``'#008000'``).
linestyle参数
*来自官方源码注释
        **Line Styles**

        =============    ===============================
        character        description
        =============    ===============================
        ``'-'``          solid line style
        ``'--'``         dashed line style
        ``'-.'``         dash-dot line style
        ``':'``          dotted line style
        =============    ===============================

        Example format strings::

            'b'    # blue markers with default shape
            'or'   # red circles
            '-g'   # green solid line
            '--'   # dashed line with default color
            '^k:'  # black triangle_up markers connected by a dotted line
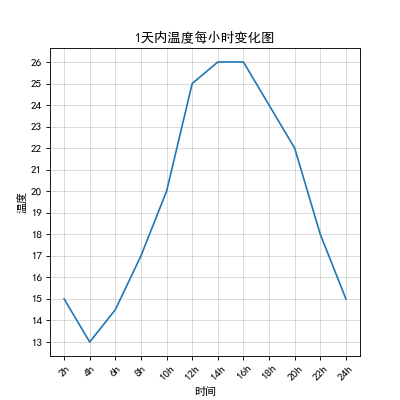
假设我们使用折线图绘制一天中每隔两个小时的气温,分别是[15,13,14.5,17,20,25,26,26,24,22,18,15]
导入matplotlib中的pyplot模块,起名叫plt。pyplot模块是matplotlib中专门用来画图用的
from matplotlib import pyplot as pltpyplot模块中有一个plo方法传入2个参数,第一个参数(可迭代对象)作为数据的x轴坐标,第二个参数(可迭代对象)作为数据的y轴坐标。我们都知道折线统计图是由不同的点一一连起来组成的。根据plot函数所需的参数可知,我们使用列表作为参数最好,一个列表作为数据的x轴坐标,一个列表作为数据的y轴坐标,两个列表一一对应起来就形成了大量的点。
例如:
x = [1,2,3,4,5]
y = [2,3,4,5,6]
则第一个点表示为(x[0],y[0])即(1,2)
现在来解决上面的问题。我们使用时间作为x轴,使用气温作为y轴。首先我们需要每隔2个小时的时间,也就是从2开始,步长为2的一个列表,列表长度为12,因为气温数据列表大小为12,我们需要一一对应。
x = range(2,26,2)
y = [15,13,14.5,17,20,25,26,26,24,22,18,15]
现在我们的点已经准备好了,开始绘制图像
plt.plot(x,y)这样还不行使用pyplot中的show函数展示出图像
plt.show()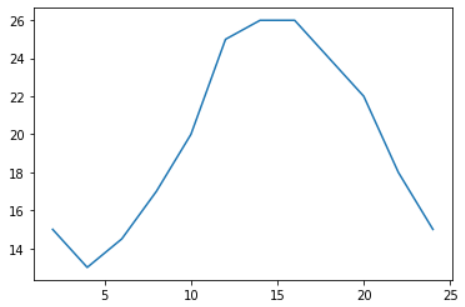
from matplotlib import pyplot as plt

x = range(2,26,2)
y = [15,13,14.5,17,20,25,26,26,24,22,18,15]

plt.plot(x,y)
plt.show()
添加描述信息
设置图片的大小|figure()方法
pyplot.figure(figsize=元组,dpi=整形数字类型)figure是图形图标的意思,figsize是设置图片的尺寸大小,dpi越大能让图片更加清晰。
保存图片|savefig()方法
pyplot.savefig(路径)这段代码应该放在绘图之后。
设置x、y轴的信息|xticks()/yticks()方法
pyplot.xticks(可迭代对象,可迭代对象,rotation=角度)#传入你想要的x轴刻度
pyplot.yticks(可迭代对象,可迭代对象,rotation=角度)#传入你想要的y轴刻度
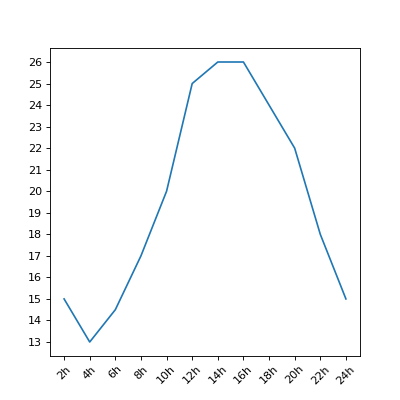
第一个参数是指定x轴的刻度,第二个参数是使用字符串为每一刻度的名称,与第一个参数一一对应,第三个参数可以指定字符串旋转角度
...
# 设置
plt.figure(figsize=(5, 5), dpi=80)  # 设置图片尺寸。清晰度
_x = [f"Hi,{i}" for i in x]
plt.xticks(x, _x, rotation=45)  # 设置图片x轴刻度
plt.yticks(range(min(y), max(y)+1))  # 设置图片y轴刻度

plt.plot(x, y)  # 绘制线条
...
设置x、y轴名称|xlabel、ylabel方法
pyplot.xlabel(字符串)#设置x轴信息
pyplot.ylabel(字符串)#设置y轴信息
设置图形名称|title()方法
pypolt.title(字符串)#设置图形名称解决中文无法显示问题
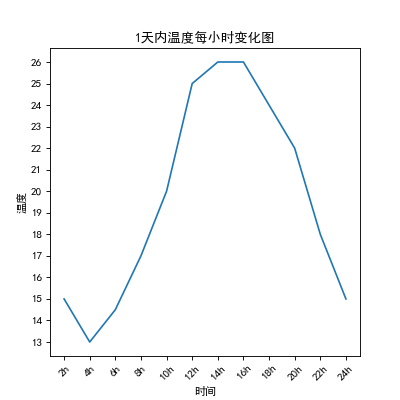
在代码中添加这段代码
plt.rcParams["font.sans-serif"] = ["SimHei"]  # 设置字体
plt.rcParams["axes.unicode_minus"] = False  # 该语句解决图像中的“-”负号的乱码问题
添加代码前
from matplotlib import pyplot as plt  # 导入matplotlib中的pyplot模块

#plt.rcParams["font.sans-serif"] = ["SimHei"]  # 设置字体
#plt.rcParams["axes.unicode_minus"] = False  # 该语句解决图像中的“-”负号的乱码问题

# 生成数据
x = range(2, 26, 2)
y = [15, 13, 14.5, 17, 20, 25, 26, 26, 24, 22, 18, 15]
_x = [f"{i}h" for i in x]

# 设置
plt.figure(figsize=(5, 5), dpi=80)  # 设置图片尺寸。清晰度
plt.xticks(x, _x, rotation=45)  # 设置图片x轴刻度
plt.yticks(range(min(y), max(y)+1))  # 设置图片y轴刻度
plt.xlabel("时间")
plt.ylabel("温度")
plt.title("1天内温度每小时变化图")

plt.plot(x, y)  # 绘制线条
plt.savefig('./matplotlib_3.png')  # 保存图片
plt.show()  # 展示图片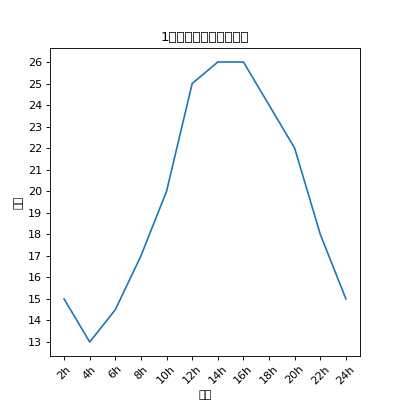
添加代码后
...
plt.rcParams["font.sans-serif"] = ["SimHei"]  # 设置字体
plt.rcParams["axes.unicode_minus"] = False  # 该语句解决图像中的“-”负号的乱码问题

# 生成数据
x = range(2, 26, 2)
y = [15, 13, 14.5, 17, 20, 25, 26, 26, 24, 22, 18, 15]
_x = [f"{i}h" for i in x]
...
绘制网格
pyplot.grid(alpha=透明度)matplotlib是根据x、y轴有多少刻度就绘制多少条线,所以如果我们觉得网格太稀疏,或太密集了,对应的我们调整x,y轴的刻度就能解决了。透明度越小越透明。网格也有同plot方法相同的linestyle,linewidth,color参数
...
plt.title("1天内温度每小时变化图")
plt.grid(alpha=0.5)#绘制网格

plt.plot(x, y)  # 绘制线条
plt.savefig('./matplotlib_4.png')  # 保存图片
...
绘制多条线
绘制线条是plot()方法,那么调用多少plot方法就可以绘制多条线条了
假如同时绘制A地(列表a)、B地(列表b)的温度
a=[15,13,14.5,17,20,25,26,26,24,22,18,15]
b=[14,14,14.5,16,18,18,22,23,22,20,19.5,17]
....
plt.figure(figsize=(5, 5), dpi=80)  # 设置图片尺寸。清晰度
plt.xticks(x, _x, rotation=45)  # 设置图片x轴刻度
plt.yticks(range(min(y_a), max(y_a)+1))  # 设置图片y轴刻度
plt.xlabel("时间")
plt.ylabel("温度")
plt.title("1天内温度每小时变化图")
plt.grid(alpha=0.5)  # 绘制网格

plt.plot(x, y_a)  # 绘制a地
plt.plot(x, y_b)  # 绘制b地
....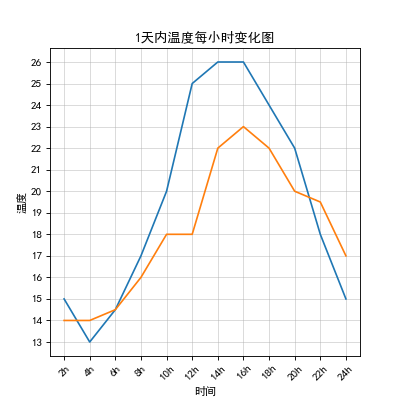
我们知道蓝线是a地,黄线是b地,但是把图拿给别人看别人就分不清了,所以我们要给线条打上标签,也就是添加图例
添加图例|legend()方法
pyplot.legend()#作用是在图上添加图例先使用plt.plot(x,y,label="该线条名称")添加第三个参数label设定该线条的名称,然后使用plt.legend()方法绘制出来
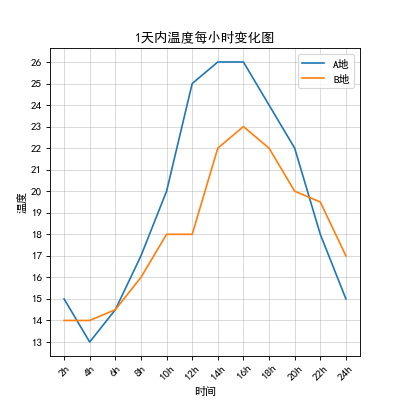
matplotlib绘制散点图
假设你要绘制北京2016年3()列表a,10(列表b)月份每天的最高气温的散点图
a = [11,17,16,11,12,11,12,6,6,7,8,9,12,15,14,17,18,21,16,17,20,14,15,15,19,21,22,22,22,23]
b = [26,26,28,19,21,17,16,19,18,20,20,19,22,23,17,20,21,20,22,15,5,13,17,10,11,13,12,13,6]
绘制散点图|scatter()方法
plt.scatter(x,y)使用方法和plot差不多一样
from matplotlib import pyplot as plt  # 导入模块

plt.rcParams["font.sans-serif"] = ["SimHei"]  # 设置字体
plt.rcParams["axes.unicode_minus"] = False  # 该语句解决图像中的“-”负号的乱码问题

# 生成数据
y_a = [11, 17, 16, 11, 12, 11, 12, 6, 6, 7, 8, 9, 12, 15, 14,
       17, 18, 21, 16, 17, 20, 14, 15, 15, 19, 21, 22, 22, 22, 23]
y_b = [24, 24, 25, 19, 21, 17, 16, 19, 18, 20, 20, 19, 22, 23,
       17, 20, 21, 20, 22, 15, 5, 13, 17, 10, 11, 13, 12, 13, 6]
x_a = range(1, 31)
x_b = range(51, 80)
_x = list(x_a)+list(x_b)
_xtick_labels = [f"3月{i}日" for i in x_a]
_xtick_labels += [f"10月{i-50}日" for i in x_b]

# 绘图
plt.figure(figsize=(10, 5), dpi=80)
plt.xticks(_x[::3], _xtick_labels[::3], rotation=45)
plt.yticks(range(min(y_a+y_b), max(y_a+y_b)))
plt.title('北京3,10月份每天最高气温散点图')
plt.xlabel("时间")
plt.ylabel("气温")

plt.scatter(x_a, y_a, label="三月份")
plt.scatter(x_b, y_b, label='10月份')
plt.legend()
plt.savefig("./matplotlib_8")
plt.show()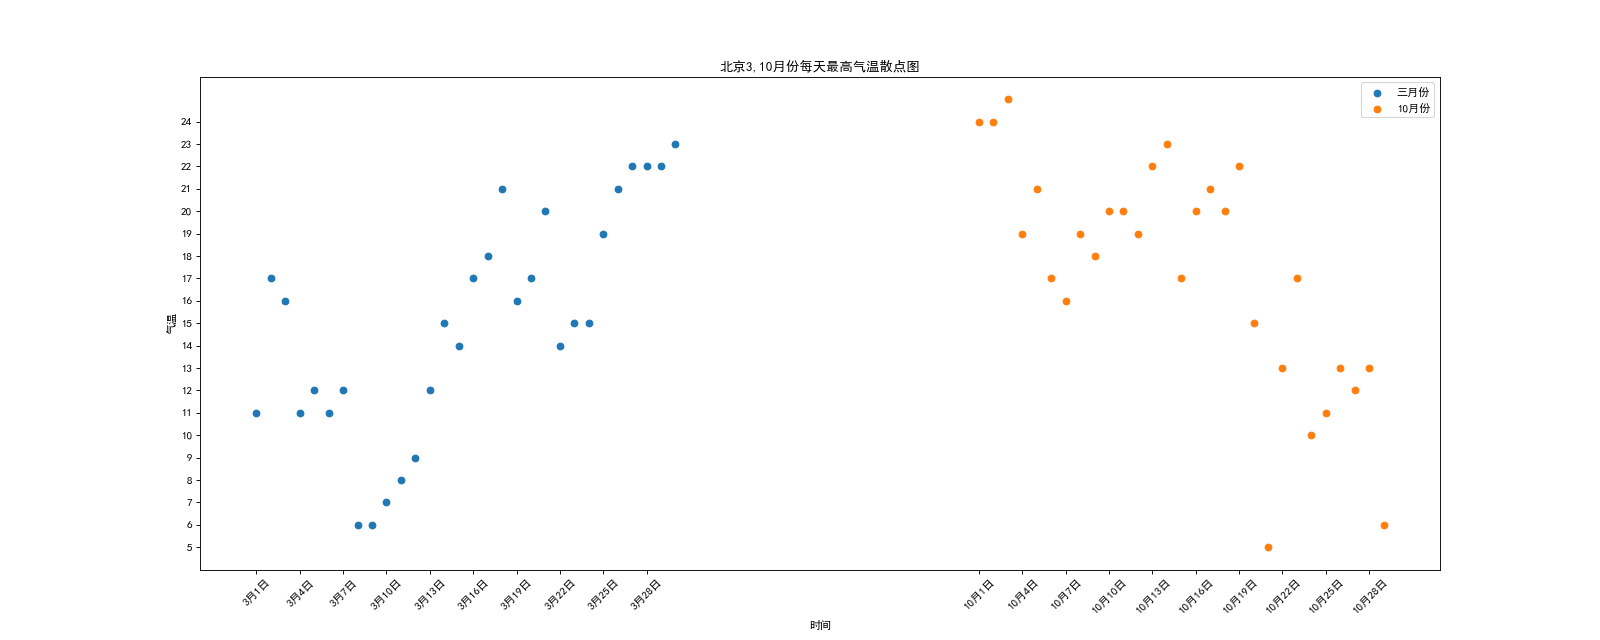
matplotlib绘制条形图
假设你获取到了2017年内地电影票房前10的电影(列表a)和电影票房数据(列表b),并绘制条形统计图
a = ["战狼2","速度与激情8","功夫瑜伽","西游伏妖篇","变形金刚5","最后的骑士","摔跤吧!爸爸","加勒比海岛5","死无对证","金刚:骷髅岛"]
b = [56.01,26.94,17.53,16.49,15.45,12.96,11.8,11.61,11.28,11.12]
绘制条形图|bar()|barh()方法
plt.bar(x,y)#只接收含数字的可迭代对象收含数字的可迭代对象,竖式,#第一个传入x,第二个传入y
plt.barh(y,x)#只接收含数字的可迭代对象收含数字的可迭代对象,横式,第一个传入y,第二个传入x因为只接收含数字的可迭代对象,所以x轴传入长条的个数。然后使用plt.xticks()|plt.yticks()使文字与其对应
第一种方式|竖式bar()方法
from matplotlib import pyplot as plt

plt.rcParams["font.sans-serif"] = ["SimHei"]  # 设置字体
plt.rcParams["axes.unicode_minus"] = False  # 该语句解决图像中的“-”负号的乱码问题

# 生成数据
a = ["战狼2", "速度与激情8", "功夫瑜伽", "西游伏妖篇", "变形金刚5",
     "最后的骑士", "摔跤吧!爸爸", "加勒比海岛5", "死无对证", "金刚:骷髅岛"]
b = [56.01, 26.94, 17.53, 16.49, 15.45, 12.96, 11.8, 11.61, 11.28, 11.12]

x = range(len(a))
_x = [f'{i}' for i in a]
y = b

# 绘图
plt.figure(figsize=(7.8, 7.8), dpi=80)
plt.title("2017年内地电影票房前10的电影票房数据")
plt.xlabel("电影")
plt.ylabel("票房(单位亿)")
plt.xticks(x, _x, rotation=30)

plt.bar(x, y, width=0.5, color="orange")#第一个传入x,第二个传入y
plt.savefig("./matplotlib_9")
plt.show()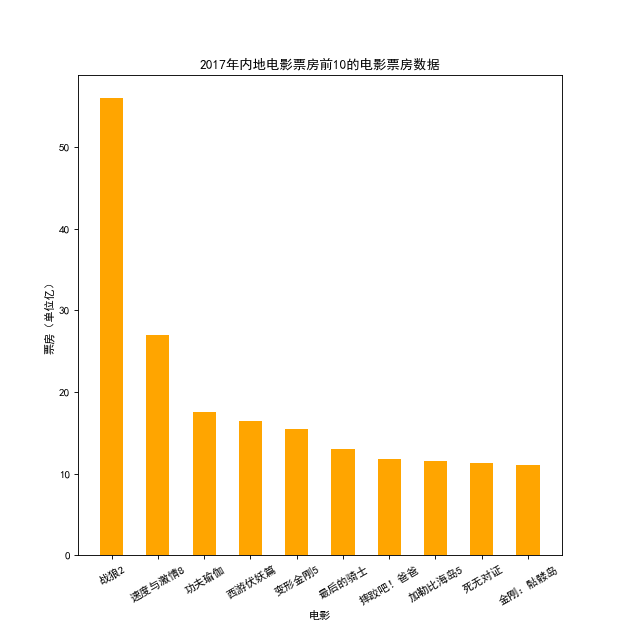
第二种方式|横式barh()方法
from matplotlib import pyplot as plt

plt.rcParams["font.sans-serif"] = ["SimHei"]  # 设置字体
plt.rcParams["axes.unicode_minus"] = False  # 该语句解决图像中的“-”负号的乱码问题

# 生成数据
a = ["战狼2", "速度与激情8", "功夫瑜伽", "西游伏妖篇", "变形金刚5",
     "最后的骑士", "摔跤吧!爸爸", "加勒比海岛5", "死无对证", "金刚:骷髅岛"]
b = [56.01, 26.94, 17.53, 16.49, 15.45, 12.96, 11.8, 11.61, 11.28, 11.12]

y = range(len(a))
_y = [f'{i}' for i in a]
x = b

# 绘图
plt.figure(figsize=(7.8, 7.8), dpi=80)
plt.title("2017年内地电影票房前10的电影票房数据")
plt.xlabel("电影")
plt.ylabel("票房(单位亿)")
plt.yticks(y, _y, rotation=60)

plt.barh(y, x, height=0.5, color="orange")#第一个传入y,第二个传入x
plt.savefig("./matplotlib_10")
plt.show()
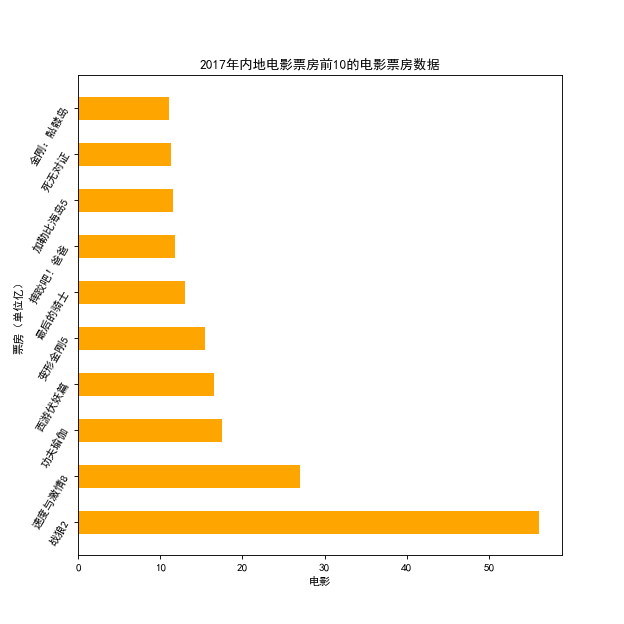
绘制多次条形图
假设你知道了列表a中电影分别在2017-09-14(b_14),2017-09-15(b_15),2017-09-16(b_16)三天的票房,绘制多次条形图进行分析
a = ["猩球崛起3:终极之战","顿可尔克","蜘蛛侠:英雄归来","战狼2"]
b_14 = [2358,399,2358,362]
b_15 = [2357,156,2045,168]
b_16 = [5746,312,4497,319]
from matplotlib import pyplot as plt

plt.rcParams["font.sans-serif"] = ["SimHei"]  # 设置字体
plt.rcParams["axes.unicode_minus"] = False  # 该语句解决图像中的“-”负号的乱码问题

# 生成数据
a = ["猩球崛起3:终极之战", "顿可尔克", "蜘蛛侠:英雄归来", "战狼2"]

b_14 = [2358, 399, 2358, 362]
b_15 = [12357, 156, 2045, 168]
b_16 = [15746, 312, 4497, 319]

y_14 = b_14
y_15 = b_15
y_16 = b_16

bar_width = 0.2  # 设置条的宽度
x_14 = list(range(len(a)))  # 设置14号每部电影的x坐标,具体为0,1,2,3
x_15 = [i+bar_width for i in x_14]  # 因为条宽为0.2所以坐标+0.2以免重合,设置16号每部电影的x坐标
x_16 = [i+bar_width for i in x_15]  # 设置16号每部电影的x坐标

# 绘制图片
plt.title("以下电影三天的票房对比图")
plt.xlabel("电影")
plt.ylabel("票房")
plt.xticks(x_15, a)  # 因为15号在中间,所以采用15号作为x坐标最好

plt.bar(x_14, y_14, width=bar_width, label="9月14日")  # 绘制出14号每部电影的票房
plt.bar(x_15, y_15, width=bar_width, label="9月15日")  # 绘制出15号每部电影的票房
plt.bar(x_16, y_15, width=bar_width, label="9月16日")  # 绘制出16号每部电影的票房
plt.legend()
plt.savefig("./matplotlib_11")
plt.show()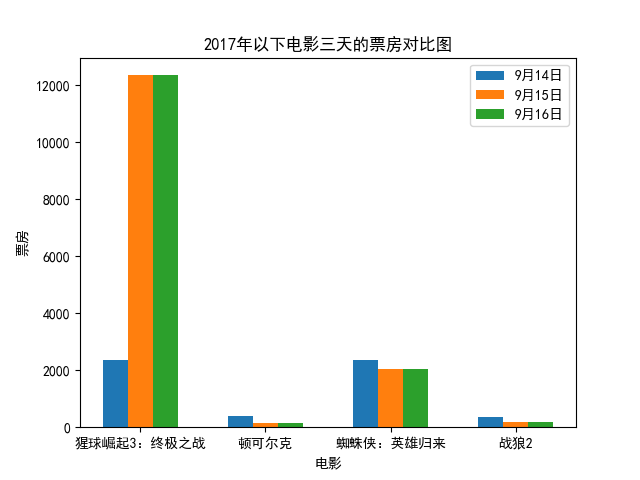
matplotlib绘制直方图
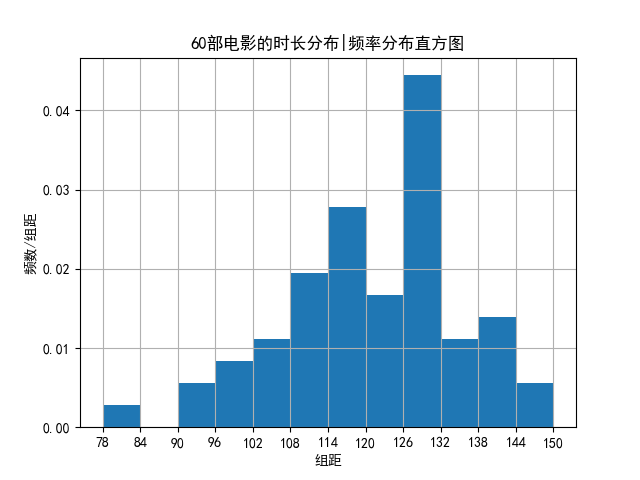
假设你获取了60部电影的时长(列表a中),使用直方图观察大多电影时长分布情况
a = [131, 98, 125, 131, 124, 139, 131, 117, 128, 108, 135, 138, 131, 102, 107, 114, 119, 128, 121, 142, 127, 130, 124, 101, 110, 116, 117, 110, 128, 128,115, 99, 136, 126, 134, 95, 138, 117, 111, 78, 132, 124, 113, 150, 110, 117, 116, 95, 144, 105, 126, 130, 126, 130, 126, 116, 123, 106, 112, 138]
绘制直方图|使用hist()方法
plt.hist(需要统计的数据list,组数)学过高一数学的都知道组数=极差/组距,极差=数据中最大-数据中最小
频数分布直方图
from matplotlib import pyplot as plt

plt.rcParams["font.sans-serif"] = ["SimHei"]  # 设置字体
plt.rcParams["axes.unicode_minus"] = False  # 该语句解决图像中的“-”负号的乱码问题

# 生成数据
a = [131, 98, 125, 131, 124, 139, 131, 117, 128, 108, 135, 138, 131, 102, 107, 114, 119, 128, 121, 142, 127, 130, 124, 101, 110, 116, 117, 110, 128, 128,
     115, 99, 136, 126, 134, 95, 138, 117, 111, 78, 132, 124, 113, 150, 110, 117, 116, 95, 144, 105, 126, 130, 126, 130, 126, 116, 123, 106, 112, 138]

bin_width = 6  # 设置组距
num_bins = (max(a)-min(a))//bin_width  # 设置组数

# 绘制图像
plt.title('60部电影的时长分布|频数分布直方图')
plt.ylabel('频数')
plt.xlabel('组距')
plt.xticks(range(min(a), max(a)+bin_width, bin_width))  # 设置x轴刻度
plt.grid()  # 绘制网格时最好让极差一定要被组数整除,不然会错位,这是网格绘制的问题

plt.hist(a, num_bins)
plt.savefig("./matplotlib_12")
plt.show()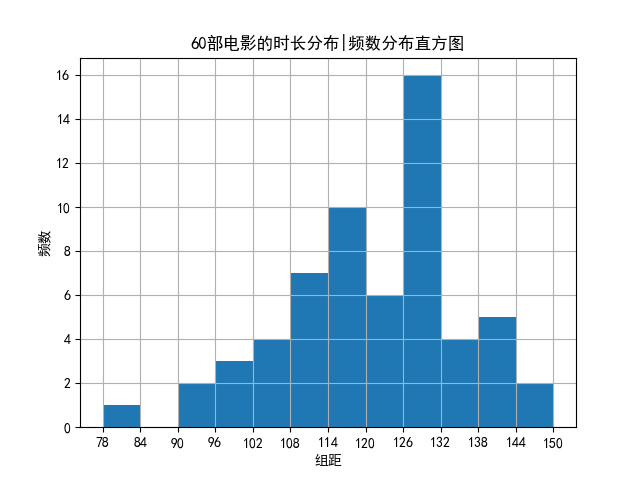
频率分布直方图
只需要在hist()方法中传入density=True就行
...
plt.xticks(range(min(a), max(a)+bin_width, bin_width))  # 设置x轴刻度
plt.grid()  # 绘制网格时最好让极差一定要被组数整除,不然会错位,这是网格绘制的问题

plt.hist(a, num_bins, density=True)
plt.savefig("./matplotlib_13")
...
matplotlib更多图形样式
matplotlib支持的图形是很多的,如果有其他需求,可以去https://matplotlib.org/stable/gallery/index.html学习,本博文也将持续更新
